NM APARTMENT
1 9 8 9
REPORT
1 9 9 8
"Market Update - Why is the Occupancy Still So Low?"
Originally appeared inNew Mexico Apartment Report Vol. 4.2 - Q2’97
Albuquerque
Our most recent market survey indicates that physical occupancy at 92.5% down from the 93.3% for the first quarter of 1997, while economic occupancy is 88%. Unfortunately, the recently predicted up-tick in occupancy has not come about.
The average per square foot rental rate has held steady for the last three quarters at $.72 per square foot. Down less than 2% from the 1996 high of $.75 per square foot.
As a resource in our marketplace, I continually hear that the over development of apartments in Albuquerque has brought the continually decrease in occupancy. Although this seems a plausible cause and effect, the recent slow down of apartment construction has not improved the overall market occupancy.
First a comparison – in the 1980’s Albuquerque built 14,573 units or 30.5% of its total market in a four year period. During that time, the vacancy in the marketplace reached an all time high of 16.7%. The 1990’s witnessed less than 5,000 units or 7.3% of the total market.
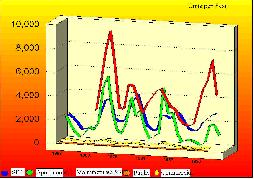
Historically there is trend in Albuquerque that decade after decade, a similar number of apartments and single family residences are developed – a relationship that is almost 1 to 1. The following graph demonstrates the same relationship in the 1990’s –
As you can see the typical 1:1 trend has decreased to a 1 to 2 ratio between apartments and single family residential. If both job and population growth have continued at a steady pace, what is filling the gap? Extensive research indicates that the gap is being filled by Manufactured Housing. (please the article in this newsletter on Manufactured Housing.)
Santa Fe
Recent construction booms had forced Santa Fe’s occupancy down to 89.7% in 1996, but a rapid absorption period in less than a year has seen the occupancy improve to 94.5%. Rent levels are at a slight increase of $.81 per square foot.
Las Cruces
Recent new construction had forced Las Cruce’s occupancy down to 92.8% in 1996, but a rapid absorption period in less than a year has seen the occupancy improve to 95.7%. Rent levels are at a slight decrease of $.57 per square foot – which seems to match the season college cycle of the past few quarters.
El Paso
El Paso, often considered an awkward market to track, has shown a recent increase in occupancy from the 90.5% to 92.4%. Rent levels have remained steady at $.59 per square foot.
Data Collection Methods
As you may know, they are several groups and companies that track apartment statistics. Although it is nice to gain regional and national attention, as a fellow owner, you should pay special attention to the source quoted. One often quoted national data collection company surveys two dozen apartment communities, consisting of grade “B” or higher apartments (which they then extrapolate to cover the whole market). Second to the data collected in the NM Apartment Report, a local assocation that represents property managers does a survey that is more representative of the marketplace, but unfortunately their by-laws prevent them from surveying non-members (so if a large property changes management, and is not a member, then those numbers are no longer accounted for).
NM Apartment Report surveys over 77,000 apartment units every quarter, utilizing the same data collection and survey methods that ensure the highest possible accuracy.
As new units are added to each marketplace, NM Apartment Report representatives visit each site and verify actual status (i.e. permit, construction, lease-up, stabilized) and incorporate the most recent information for each quarter.
Article by
by Todd Clarke CCIM (www.nmcomreal.com/nmcomreal)
p a g e
o n e